Web site logical path: [www.psy.gla.ac.uk] [~steve] [best] [this page]
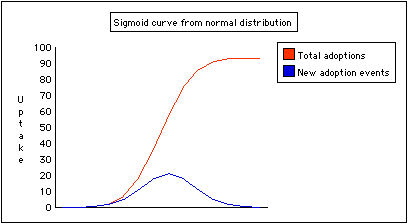
It is often said that innovations or new practices are taken up in an S-shaped or sigmoid curve. That is, there are broadly three phases. First just a few take it up: early adopters, the first few percent, over a long slow initial period of low usage; the first low slope of slow increase, and low total use. The third phase is also a low slope and slow increase, but high total use: these are the last reluctant ones. The second, middle phase has a high slope of rapid increase.
This view is attributed to Everett M. Rogers, and is described in his textbook "Diffusion of Innovations" (1962; 4th edition dated 1995; The Free Press; New York) e.g. ch.1 p.11 fig.1-1.
In fact you will get a sigmoid curve for cumulative adoption if the underlying rate of new adopters (new adoption events) forms a normal distribution (and if there is no significant rate of people dropping the innovation).

Rogers also talks of pro-innovation bias: from the tendency to study only those innovations that in fact did spread and become ubiquitous. Clearly such cases are no guide to what determines uptake in general.
Web site logical path:
[www.psy.gla.ac.uk]
[~steve]
[best]
[this page]
[Top of this page]